Debuggers
From Genome Analysis Wiki
Jump to navigationJump to searchDebuggers
Advantages/Disadvantages
- Advantages
- Single step through the code
- Stop execution at a given point to investigate where it goes and what the values are
- Attach to an already running program
- Disadvantages
- Not running real-time, so may not expose all problems
DDD
How to Compile for Debug
Compile with the option: -ggdb -O0
For the statgen library, you can compile with: make OPTFLAG="-ggdb -O0"
How to Start DDD
On a linux command line, type: ddd pathToYourExecutable/yourExecutable &
Do not specify command line options at this point. That will be done later when you type "run"
How to Use DDD
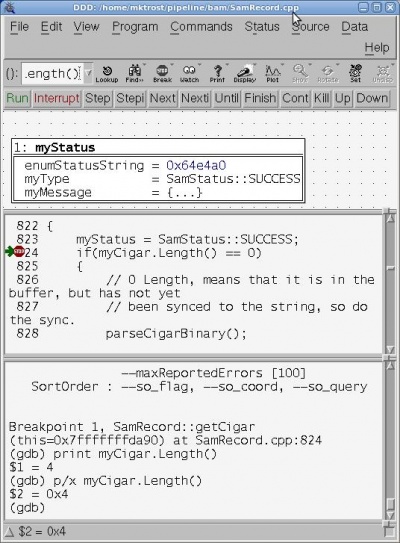
Debugging Tools
- Run: start the program with the previously specified options
- Interrupt: stop the program from running
- Step: Go into the function call (or go to next line of code)
- Next: Go over a function call (execute it, but do not step into it)
- Finish: Continue execution until the end of the current method
- Cont: Continue execution until the next breakpoint or the end of the program is reached.
- Kill: stop the program from running.
Basic Usage
Bring up a file in the viewer
- At the gdb prompt:
l <filename>:<line#>- -or -
l <class>::<method>
Examples:
l SamRecord.cpp:1l SamRecord::getCigar
Set a breakpoint
- Use mouse right-click on the line number
- Set Breakpoint (can set properties – break after hit X number of times, etc)
- -or-
- At the gddb prompt:
b <class>::<method>
Attach to already running process
- File->Attach to Process
