Debuggers
From Genome Analysis Wiki
Jump to navigationJump to searchThe printable version is no longer supported and may have rendering errors. Please update your browser bookmarks and please use the default browser print function instead.
Debuggers
Advantages/Disadvantages
- Advantages
- Single step through the code
- Stop execution at a given point to investigate where it goes and what the values are
- Attach to an already running program
- Disadvantages
- Not running real-time, so may not expose all problems
DDD
How to Compile for Debug
Compile with the option: -ggdb -O0
For programs using libStatGen, you can compile with: make debug, which will generate a debug executable in bin/debug/
How to Start DDD
On a linux command line, type: ddd pathToYourDebugExecutable/yourExecutable &
Do not specify command line options at this point. That will be done later when you type "run"
How to Use DDD
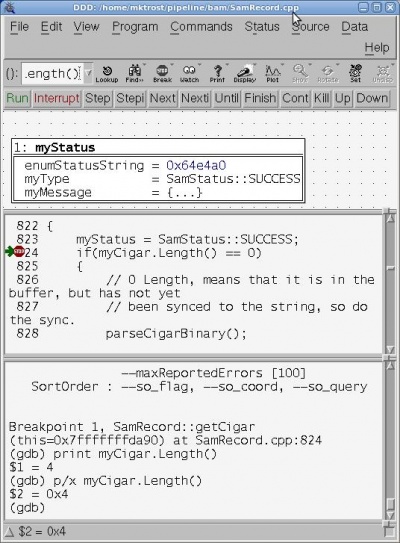
Debugging Tools
- Run: start the program with the previously specified options
- Interrupt: stop the program from running
- Step: Go into the function call (or go to next line of code)
- Next: Go over a function call (execute it, but do not step into it)
- Finish: Continue execution until the end of the current method
- Cont: Continue execution until the next breakpoint or the end of the program is reached.
- Kill: stop the program from running.
Basic Usage
Bring up a file in the viewer
- At the gdb prompt:
l <filename>:<line#>- -or -
l <class>::<method>
Examples:
l SamRecord.cpp:1l SamRecord::getCigar
Set a breakpoint
- Use mouse right-click on the line number
- Set Breakpoint (can set properties – break after hit X number of times, etc)
- -or-
- At the gdd prompt:
b <class>::<method>
Attach to already running process
- On the Menu Bar:
- File->Attach to Process
Run with options
- At the gdb prompt run your program with options, replacing your executable name with "run":
run <options>
Backtrace (see where you are in execution, look up/down the call stack)
- On the Menu Bar:
- Status->Backtrace
See a variable's value
- Right click the variable in the source code window and click “Print” (or to keep it tracked, click “Display”)
- -or-
- At the gdb prompt:
p <variable>
- To Print in hex, At the gdb prompt:
p/x <variable>
Segmentation Faults
If you get a segmentation fault when running your code, you can tell it to generate a core dump and look at that with DDD.
- Run/generate the core dump using the debug executable - as this is easiest to look at in DDD.
- Prior to running, enable core dumps in the shell/terminal where you are running:
- BASH/sh:
ulimit -c unlimited
- csh/tcsh:
limit core unlimited
- You will need to do this in each new terminal.
- When you hit a segmentation fault, it will generate a "core" file.
- BASH/sh:
- Prior to running, enable core dumps in the shell/terminal where you are running:
- Load the core file in DDD.
ddd path/to/bin/debug/exe /path/to/core&
- specifying the path to the debug executable that was run & the path to the generated core file
- Use backtrace to see where the problem occurred.
Other Testing Advice
- Reduce test size from one that takes hours to one that is much quicker.
- Reduce file sizes
- Turn off unnecessary sections
- Output intermediate files
- For validation
- To pick up where left off
- Output informative information to a file
- Write a set of automated tests
- Test many different cases
- Re-run each time the library/code changes
- When you find a bug, write a test that exposes the bug (fails), fix the bug, rerun the test (succeeds)
- Ensures bugs do not reappear
