SeqShop: Ancestry On Your Own Genome, December 2014
Login to the seqshop-server Linux Machine
This section will appear redundantly in each session. If you are already logged in or know how to log in to the server, please skip this section
- Login to the windows machine
- The username/password for the Windows machine should be written on the right-hand monitor
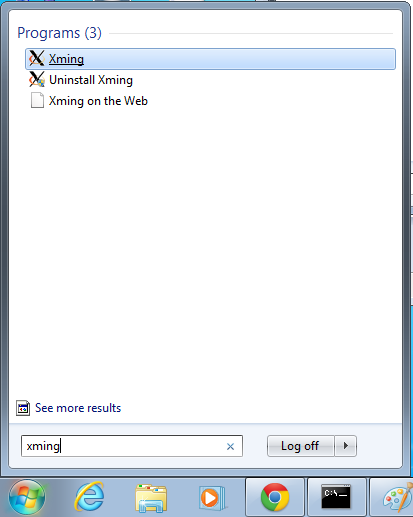
- Start->Enter "Xming" in the search and select "Xming" from the program list
- Nothing will happen, but Xming was started.
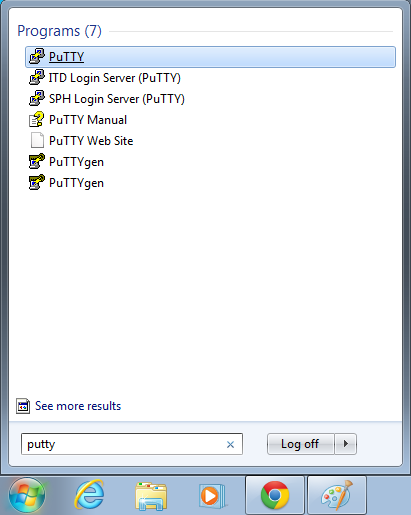
- Start->Enter "putty" in the search and select "PuTTY" from the program list
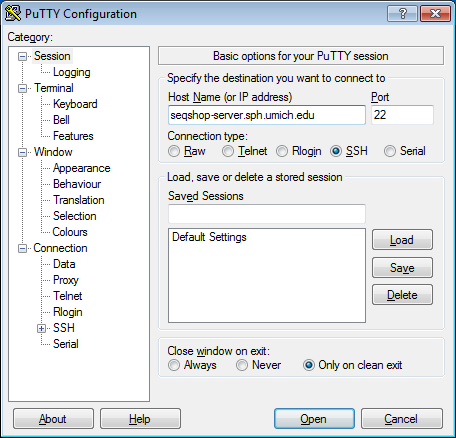
- Host Name:
seqshop-server.sph.umich.edu - Setup to allow you to open external windows:
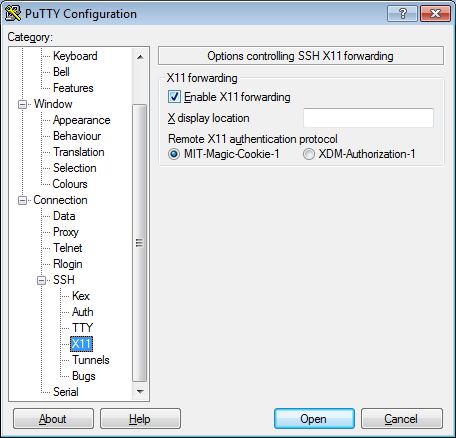
- In the left pannel: Connection->SSH->X11
- Add a check mark in the box next to
Enable X11 forwarding - Click
Open - If it prompts about a key, click
OK
You should now be logged into a terminal on the seqshop-server and be able to access the test files.
- If you need another terminal, repeat from step 3.
Login to the seqshop Machine
So you can each run multiple jobs at once, we will have you run on 4 different machines within our seqshop setup.
- You can only access these machines after logging onto seqshop-server
3 users logon to:
ssh -X seqshop1
3 users logon to:
ssh -X seqshop2
2 users logon to:
ssh -X seqshop3
2 users logon to:
ssh -X seqshop4
Setup
If you were sequenced, set these values:
export SAMPLE=Sample*
source /net/seqshop-server/home/mktrost/seqshop/setupSS.txt
source /net/seqshop-server/home/chaolong/LASER-Tutorial/setup.txt
If you were not sequenced, set these values:
export SAMPLE=NA12878
source /net/seqshop-server/home/mktrost/seqshop/setupSS.txt
source /net/seqshop-server/home/chaolong/LASER-Tutorial/setup.txt
After setting this, also do
mkdir -p $OUT/ancestry
Verify that this does not give an error:
ls $OUT/bams/${SAMPLE}.recal.bam
Run
Step 1: bam --> pileup
$GC/bin/samtools mpileup -q 30 -Q 20 -f $REF/human.g1k.v37.fa -l $HGDP/HGDP_938.bed $OUT/bams/${SAMPLE}.recal.bam > $OUT/ancestry/${SAMPLE}.HGDP.pileup
This step takes ~1 hour for a genome sequenced at 17X.
Step 2: pileup --> seq
python $LASER/pileup2seq/pileup2seq.py \
-m $HGDP/HGDP_938.site \
-o $OUT/ancestry/$SAMPLE.HGDP \
$OUT/ancestry/$SAMPLE.HGDP.pileup
This step takes just a few seconds.
Estimate ancestry
This step will take about 5-6 minutes.
$LASER/laser -g $HGDP/HGDP_938.geno -c $HGDP/HGDP_938.RefPC.coord -s $OUT/ancestry/$SAMPLE.laser.seq -K 20 -k 4 -M 0.8 -o $OUT/ancestry/$SAMPLE.HGDP &
View the results:
less -S $OUT/ancestry/${SAMPLE}.HGDP.SeqPC.coord
Visualizing Ancestry
Copy the R code to plot your ancestry
cp -r $LASER/plot/ $OUT/ancestry/.
Change to that new directory:
cd $OUT/ancestry/plot
Generate the plot:
Rscript plotHGDP.r $HGDP/HGDP_938.RefPC.coord $OUT/ancestry/${SAMPLE}.HGDP.SeqPC.coord
Take a look:
evince Results_on_HGDP.pdf &
Interested in looking just at European or East Asian or Central South Asian populations?
Population information
8 European populations in the HGDP dataset, including 156 individuals in total.
17 East Asian populations in the HGDP dataset, including 215 individuals after excluding 4 outliers (defined as more than 5 standard deviations from mean in any of top 10 PCs, 1 removal iteration).
8 Central/South Asian populations in the HGDP dataset, including 195 individuals after excluding 5 outliers (defined as more than 5 standard deviations from mean in any of top 10 PCs, 1 removal iteration). Note that 7 out of these 8 population were collected in Pakistan and 1 was collected in China (Uygur).
Step 1: bam --> pileup
You can skip this, you already did it.
Step 2: pileup --> seq
You can skip this step too, because you already did it.
Estimate ancestry
This step will take a few seconds.
For European ancestry:
$LASER/laser -g $HGDP/HGDP.633K.euro.geno -c $HGDP/HGDP.633K.euro.RefPC.coord -s $OUT/ancestry/$SAMPLE.HGDP.seq -K 20 -k 4 -M 0.8 -o $OUT/ancestry/$SAMPLE.HGDP-Euro &
For East Asian ancestry:
$LASER/laser -g $HGDP/HGDP.633K.easia.2.geno -c $HGDP/HGDP.633K.easia.2.RefPC.coord -s $OUT/ancestry/$SAMPLE.HGDP.seq -K 20 -k 4 -M 0.8 -o $OUT/ancestry/$SAMPLE.HGDP-EAsia &
For Central/South Asian ancestry:
$LASER/laser -g $HGDP/HGDP.633K.csasia.2.geno -c $HGDP/HGDP.633K.csasia.2.RefPC.coord -s $OUT/ancestry/$SAMPLE.HGDP.seq -K 20 -k 4 -M 0.8 -o $OUT/ancestry/$SAMPLE.HGDP-CSAsia &
View the results:
less -S $OUT/ancestry/${SAMPLE}.HGDP-Euro.SeqPC.coord
or
less -S $OUT/ancestry/${SAMPLE}.HGDP-EAsia.SeqPC.coord
or
less -S $OUT/ancestry/${SAMPLE}.HGDP-CSAsia.SeqPC.coord
Visualizing Ancestry
Copy the R code to plot your ancestry
cp -r $LASER/plot/ $OUT/ancestry/.
Change to that new directory:
cd $OUT/ancestry/plot
Move your other plot so you don't over-write it
mv Results_on_HGDP.pdf Results_on_HGDP_All.pdf
Generate the plot:
Rscript plotHGDP.r $HGDP/HGDP.633K.euro.RefPC.coord $OUT/ancestry/${SAMPLE}.Euro.laser.1.SeqPC.coord
Take a look:
evince Results_on_HGDP.pdf &


