Test EPACTS for DIAGRAM
Download EPACTS
EPACTS is available for download here (100Mb) .
Requirements
- Linux 64bit
- Perl 5
Install EPACTS
Uncompress EPACTS package to the directory you would like to install
tar xzvf epacts_v2_12.noref_binary.2012_10_01.tar.gz
Download the reference FASTA files from 1000 Genomes FTP automatically by running the following commands
cd epacts2.1/
./ref_download.sh
(For advanced users, to save time for downloading the FASTA files (~900MB), you may copy a local copy of GRCh37 FASTA file and the index file to ${EPACTS_DIR}/ext/ref/)
Accessing help
For a list of commands available in EPACTS, type in the following commands:
$ epacts2.1/epacts help

Usage:
epacts [command] [options]

Command:
help Print out brief help message
man Print the full documentation in man page style
single Perform single variant association
group Perform groupwise (burden-style) association test
anno Annotate a VCF file
zoom Create a locus zoom plot from epacts results
meta Perform meta-analysis across multiple epacts results
make-group Create the group information for gene-based testing
make-kin Create a kinship matrix

Visit http://genome.sph.umich.edu/wiki/EPACTS for more detailed documentation
To view options for single variant testing only type in:
$ epacts2.1/epacts single -help
Usage:
epacts single [options]

Required Options (Run epacts single -man or see wiki for more info):
-vcf STR Input VCF file (tabixed and bgzipped)
-ped STR Input PED file for phenotypes and covariates
-out STR Prefix of output files
-test STR Statistical test to use
...
Getting started in EPACTS with an example
Once installed, test out the software by running a quick example using the test data provided in the "example" directory. The example VCF and PED files are:
$ epacts2.1/example/1000G_exome_chr20_example_softFiltered.calls.vcf.gz

$ epacts2.1/example/1000G_dummy_pheno.ped
Run the single variant score test on the example data using this command:
$ epacts2.1/epacts single \
--vcf epacts2.1/example/1000G_exome_chr20_example_softFiltered.calls.vcf.gz \
--ped epacts2.1/example/1000G_dummy_pheno.ped \
--min-maf 0.001 --chr 20 --pheno DISEASE --cov AGE --cov SEX --test b.score --anno \
--out {OUTPUT_DIR}/test --run 2 &
This command will run the single variant test on the input VCF and PED files, with a minimum MAF threshold of 0.001. The phenotype is "DISEASE" and we are adjusting the analysis with covariates AGE and SEX. The output file directory prefix is {OUTPUT_DIR}/test. Finally, EPACTS will run the analysis in parallel on 2 CPUs.
Expected output
EPACTS produces a number of files and plots.
1. test.epacts.gz contains all the association results.
$ head {OUTPUT_DIR}/test.epacts
#CHROM  BEGIN   END     MARKER_ID       NS      AC      CALLRATE        MAF     PVALUE  SCORE   N.CASE  N.CTRL  AF.CASE AF.CTRL
20      68303   68303   20:68303_A/G_Upstream:DEFB125   266     1       1       0.0018797       NA      NA      NA      NA      NA      NA
20      68319   68319   20:68319_C/A_Upstream:DEFB125   266     0       1       0       NA      NA      NA      NA      NA      NA
20      68396   68396   20:68396_C/T_Nonsynonymous:DEFB125      266     1       1       0.0018797       NA      NA      NA      NA      NA      NA
20      76635   76635   20:76635_A/T_Intron:DEFB125     266     0       1       0       NA      NA      NA      NA      NA      NA
20      76689   76689   20:76689_T/C_Synonymous:DEFB125 266     0       1       0       NA      NA      NA      NA      NA      NA
20      76690   76690   20:76690_T/C_Nonsynonymous:DEFB125      266     1       1       0.0018797       NA      NA      NA      NA      NA      NA
20      76700   76700   20:76700_G/A_Nonsynonymous:DEFB125      266     0       1       0       NA      NA      NA      NA      NA      NA
20      76726   76726   20:76726_C/G_Nonsynonymous:DEFB125      266     0       1       0       NA      NA      NA      NA      NA      NA
20      76771   76771   20:76771_C/T_Nonsynonymous:DEFB125      266     3       1       0.0056391       0.68484 0.40587 145     121     0.013793        0.0082645
The columns in the results file are:
- CHROM: chromosome
- BEGIN: starting position
- END: ending position (same as BEGIN if a SNP)
- MARKER_ID: name of varian
- NS: Number of samples (cases + controls)
- AC: Total allele count in sample
- CALLRATE: call rate
- MAF: minor allele frequency in full sample
- PVALUE: score test association p-value
- SCORE: test statistic for score test
- N.CASE: number of cases
- N.CTRL: number of controls
- AF.CASE: allele frequency in cases only
- AF.CTRL: allele frequency in controls only
Note: For variants below the minimum MAF threshold (min-maf = 0.001), the number of cases and controls (N.CASE, N.CTRL) are not outputted (listed as "NA").
2. test.epacts.top5000 contains the top 5000 associated variants ordered by p-value.
$ head {OUTPUT_DIR}/test.epacts.top5000
#CHROM  BEGIN   END     MARKER_ID       NS      AC      CALLRATE        MAF     PVALUE  SCORE   N.CASE  N.CTRL  AF.CASE AF.CTRL
20      1610894 1610894 20:1610894_G/A_Synonymous:SIRPG 266     136     1       0.25564 0.0001097       3.8681  145     121     0.64138 0.35537
20      4162411 4162411 20:4162411_T/C_Intron:SMOX      266     204     1       0.38346 0.00055585      -3.4523 145     121     0.62759 0.93388
20      34061918        34061918        20:34061918_T/C_Intron:CEP250   266     39      1       0.073308        0.0011231       3.2577  145     121     0.21379 0.066116
20      4155948 4155948 20:4155948_G/A_Intron:SMOX      266     215     1       0.40414 0.0020791       -3.0787 145     121     0.68276 0.95868
20      4680251 4680251 20:4680251_A/G_Nonsynonymous:PRNP       266     186     1       0.34962 0.0025962       3.0119  145     121     0.8069  0.57025
20      36668874        36668874        20:36668874_G/A_Synonymous:RPRD1B       266     96      1       0.18045 0.003031        2.9646  145     121     0.44828 0.2562
20      36641871        36641871        20:36641871_G/A_Synonymous:TTI1 266     10      1       0.018797        0.004308        -2.8547 145     121     0.0068966       0.07438
20      32664926        32664926        20:32664926_G/A_Nonsynonymous:RALY      266     20      1       0.037594        0.0046365       2.8313  145     121     0.11724 0.024793
20      34288854        34288854        20:34288854_C/T_Utr3:ROMO1      266     28      1       0.052632        0.0047722       2.822   145     121     0.15862 0.041322
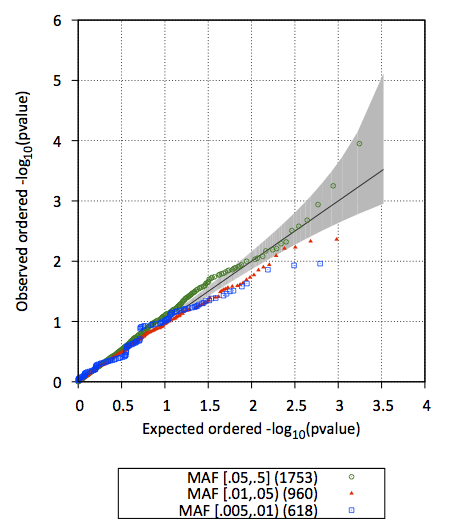
3. test.epacts.qq.pdf contains the Q-Q plot of test p-values (stratified by MAF)
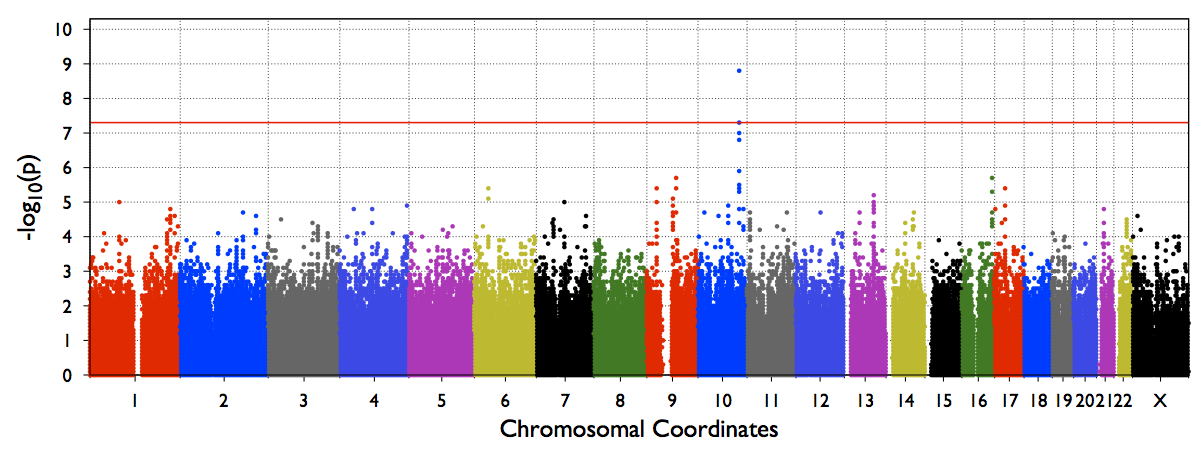
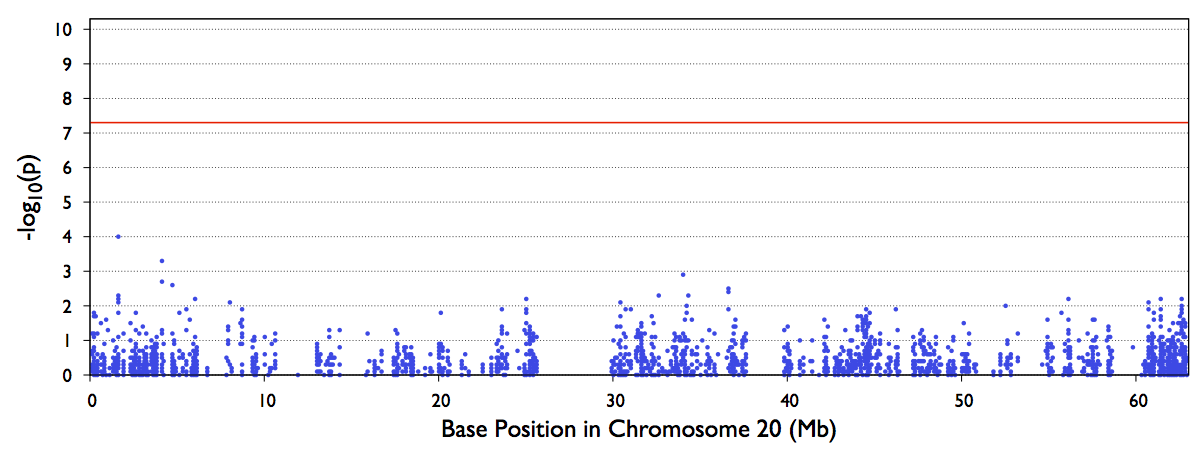
4. test.epacts.mh.pdf contains the Manhattan Plot of test p-values
The file out/test.b.score.epacts.mh.pdf will be generated for chr20 only.
An example Genome-wide manhattan plot (from a genome-wide run) will look like below

