MEAGA
Introduction
Pathway analysis for results from genetic association studies could help us better understand complex traits. MEAGA (Minimum distance-based Enrichment Analysis for Genetic Association) performs functional/pathway enrichment test while integrating network information from biological interactome (e.g. protein-protein interaction network) using graphical algorithm techniques.
The latest version of MEAGA could be obtained in here:
How it works
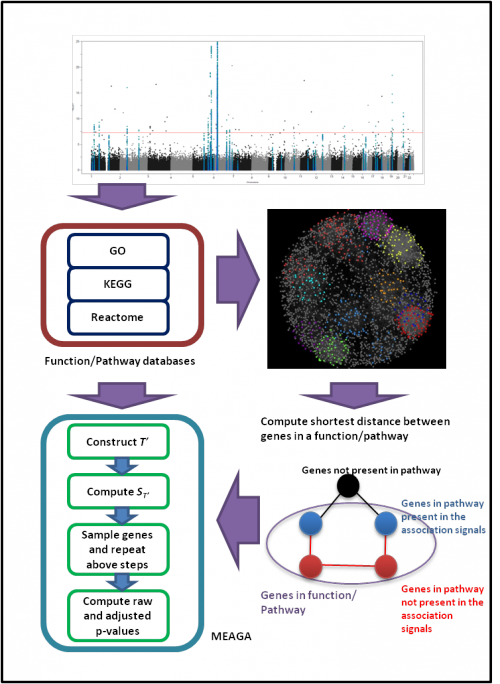
MEAGA tests the hypothesis that genes from the susceptibility loci in the trait/disease-associated function/pathway are closer with each other in the biological interactome. MEAGA takes the markers used in the association results as input. Users would pre-specify the association signals and annotate the tagged genes for each marker (e.g. using linkage disequilibrium- or genomic distance- based block).
For each functional gene-set being tested, MEAGA first identifies the overlapping genes from the signals, then utilizes graphical algorithms (Kou's algorithm to identify Steiner Tree(s)) to construct subgraph(s) with minimum distance(s) in the interactome. MEAGA computes a statistic (S) summarizing the amount of overlapping genes and the overall shortest distance(s) of the subgraph(s). MEAGA uses sampling strategy to approximate the null distribution of S and compute empirical and multiple testing-corrected p-values.
MEAGA was implemented in Python, and it requires the graphical features from NetworkX (Hagberg et al. 2008): https://networkx.github.io/.
The overview workflow of MEAGA:

|
Usage instructions
Input Files
Functional/Pathway annotation file
Three-column file annotates the gene's associated functions/pathways (2nd column) and the source (e.g. Gene Ontology)
We provided a pre-compiled functional annotation file:
./db/gene2fun.txt
We obtained the functional and pathway annotation data from the GO (Ashburner et al. 2000), KEGG (Kanehisa et al. 2012), and Reactome (Croft et al. 2013) databases. We processed the GO’s gene-to-GO file so we also annotated each gene with the “ancestral” terms of its annotated term(s).
Marker to Gene annotation file
A 5-column file for marker to gene annotation. The first four columns are the same as plink-map file, and the last column indicates the annotated genes (separated by semicolon).
Example:
./example/marker2gene.txt
Associated signals
A 1-column file for the best signals identified in the genetic association study
Example:
./example/intmarkers
pre-calculated shortest path distances (see below)
Command References
| Option | Name | Descritption | Required | Default value |
|---|---|---|---|---|
| -s | --marker2gene | marker to gene annotation file | Yes | NA |
| -g | --gene2fun | function/pathway annotation file | Yes | NA |
| -i | --intmarkers | associated signals | Yes | NA |
| -d | --funSPdir | directory storing the prefix folders for each function shortest-path files | Yes | NA |
| -o | --outDir | output directory and prefix | Yes | NA |
| -t | --numProcess | number of process used | No | 1 |
| -n | --numsamples | number of samplings used to construct null distribution of S | No | 10,000 |
| -m | --minFun | only used function/pathway with this minimum number of genes | No | 5 |
| -M | --maxFun | only used function/pathway with this maximum number of genes | No | 1000 |
| -a | --minIntFun | minimum number of associated genes overlapped with the genes in the function/pathway | No | 3 |
| -D | --Dmax | distance value set for genes not connected in the interactome | No | 12 |
If you need help in understanding the options, you could type:
./bin/MEAGA.py --help
Output files
There are two final output files for MEAGA: MEAGAresult and MEAGAtree.
Descriptions for MEAGAresult columns
| Funs | NumFunGenes | NumFunIntGenes | NumConnectedGraphs | AvgIntFunGenes_perConnectedGraphs | S | pval | adj-pval |
|---|---|---|---|---|---|---|---|
| function/pathway | # of annotated genes in function | # of genes from associated loci annotated with function | # of connected graph(s) identified | Third column / Fourth column | statistic used in MEAGA | p-value | adjusted p-value for multiple testing |
MEAGAtree provides the link between the genes (second and third columns) for the steiner tree(s) constructed for each function/pathway (first column)
Plot
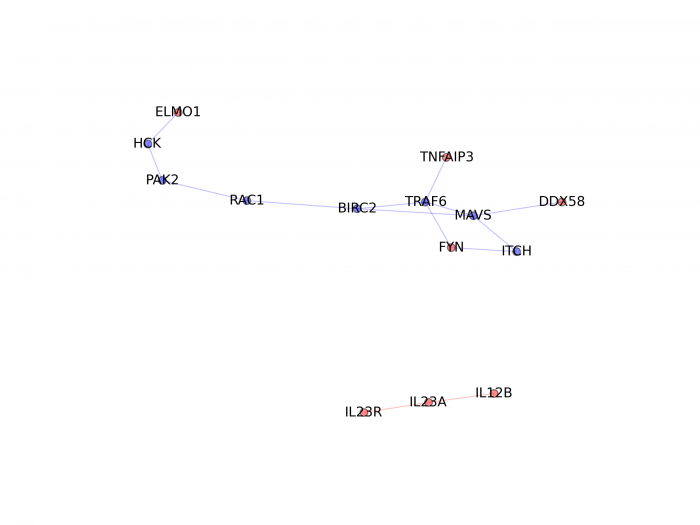
If you want to visualize the shortest paths between the genes from the associated regions in a particular function/pathway, we provide a python function (it requires the matplotlib module from python) to generate plot (genes from associated regions are in red; other genes present in the shortest paths are in blue):
./bin/plotFunIntPPI.py -a ./db/gene2fun.txt -s ./db/splitFun_fungenesSP_BioGrid/R/REGULATION_OF_RESPONSE_TO_BIOTIC_STIMULUS -p REGULATION_OF_RESPONSE_TO_BIOTIC_STIMULUS -m ./example/marker2gene.txt -i ./example/intmarkers -o ./test/testMEAGA_plot
This will generate a figure for the function "regulation of response to biotic stimulus":

|
If you need help for this function, you could type:
./bin/plotFunIntPPI.py --help
Pre-calculated shortest path distance
The construction of Steiner trees is time consuming. The Kou’s algorithm requires the shortest distances and their paths to be first computed between genes. For effective performance, we pre-computed all shortest paths between genes in each function/pathway gene-set using data downloaded from different data sources and stored them in database to be readily retrieved when performing the Kou’s algorithm. We provide users copies of the compiled databases of shortest paths for interaction data obtained BioGrid (http://thebiogrid.org/), HPRD (http://www.hprd.org/), and STRING (http://string-db.org/).
If user wants MEAGA do perform enrichment test using the custom-interactome data (e.g. from other PPI source, or interaction data obtained from co-expression or text-mining analysis), we also provide a function to pre-compute all shortest paths for the custom data:
./bin/makeSP2Fun.py -i custom-interactome -g ./db/gene2fun.txt -o ./db/custom_splitFun_fungenesSP/ -f -m 3 -M 1000
custom-interactome is a two-column file indicating the gene pairs with biological association. gene2fun.txt is a file annotating the gene to function/pathway relationships (see above). The (-m and -M) parameters specify the minimum and maximum number of genes in the functions/pathways to be considered, respectively. By default (-F) computation of shortest path between genes within a function/pathway would use all genes in the interactome, if user only uses genes within the pathway, (-f) could be specified.
Tutorial
Using the markers from the Immunochip and the genetic association results from a meta-analysis (http://www.nature.com/ng/journal/v44/n12/abs/ng.2467.html), we provide the --marker2gene and the --intmarkers example files:
./example/marker2gene.txt
./exampleintmarkers
An example script for running MEAGA is also provided in ./example/testscript (run under the ./example directory)
../bin/MEAGA.py -s marker2gene.txt -g ../db/gene2fun.txt -i intmarkers -d ../db/splitFun_fungenesSP_BioGrid/ -o ../test/test -a 2 -m 5 -M 500 -t 10 -n 5000
The result files of the above scripts are stored in ../test/ with prefix "test".
It is not uncommon to observe genes coming from the same locus being annotated with the same function/pathway, if you want to restrict the analysis to functions/pathways overlapping with the associated genes which are all coming from different loci, you could use the provided function:
./bin/trimFun_NumIntFunGenesLoci.R ./example/interestedregionsgenes ./db/gene2fun.txt ./test/testMEAGAresult 0 ./test/testMEAGAresult_unique
"interestedregionsgenes" is an one-column file with each row represents one unique locus, and the associated genes within the locus are separated by the semi-colon. "0" represents the difference between the number of function/pathway- overlapping genes and the number of function/pathway- overlapping loci we want.
Citation
Contact
If you have any questions, please contact [Alex Lam C Tsoi].